Gantt chart makers are widely used to visualize project timelines, task dependencies, and progress.
In networking and IT projects, these tools help translate technical work into clear, trackable schedules.
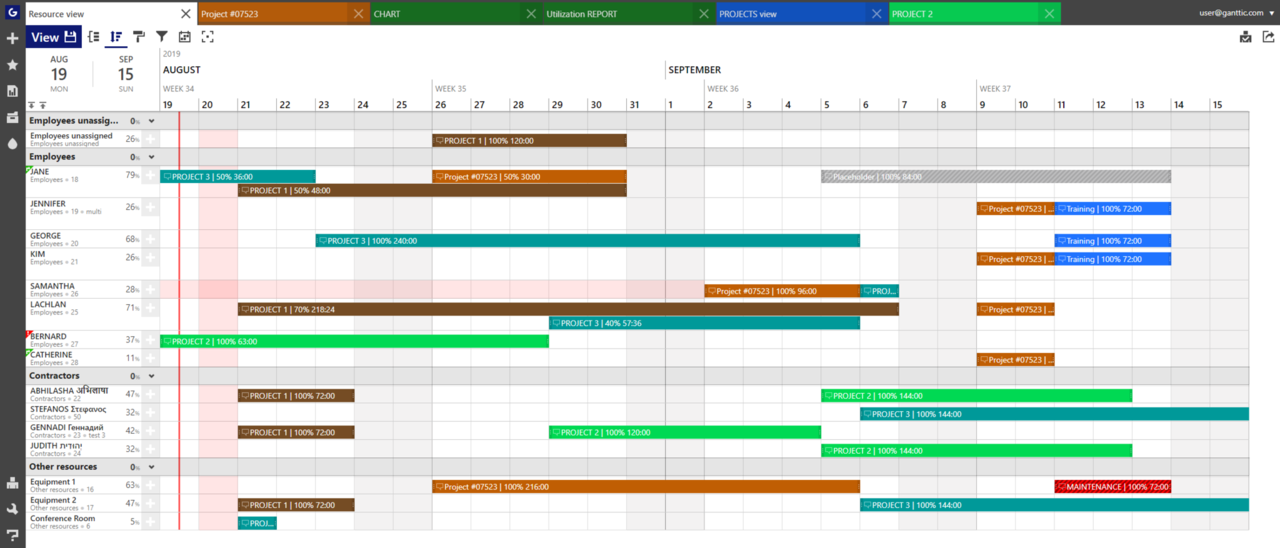
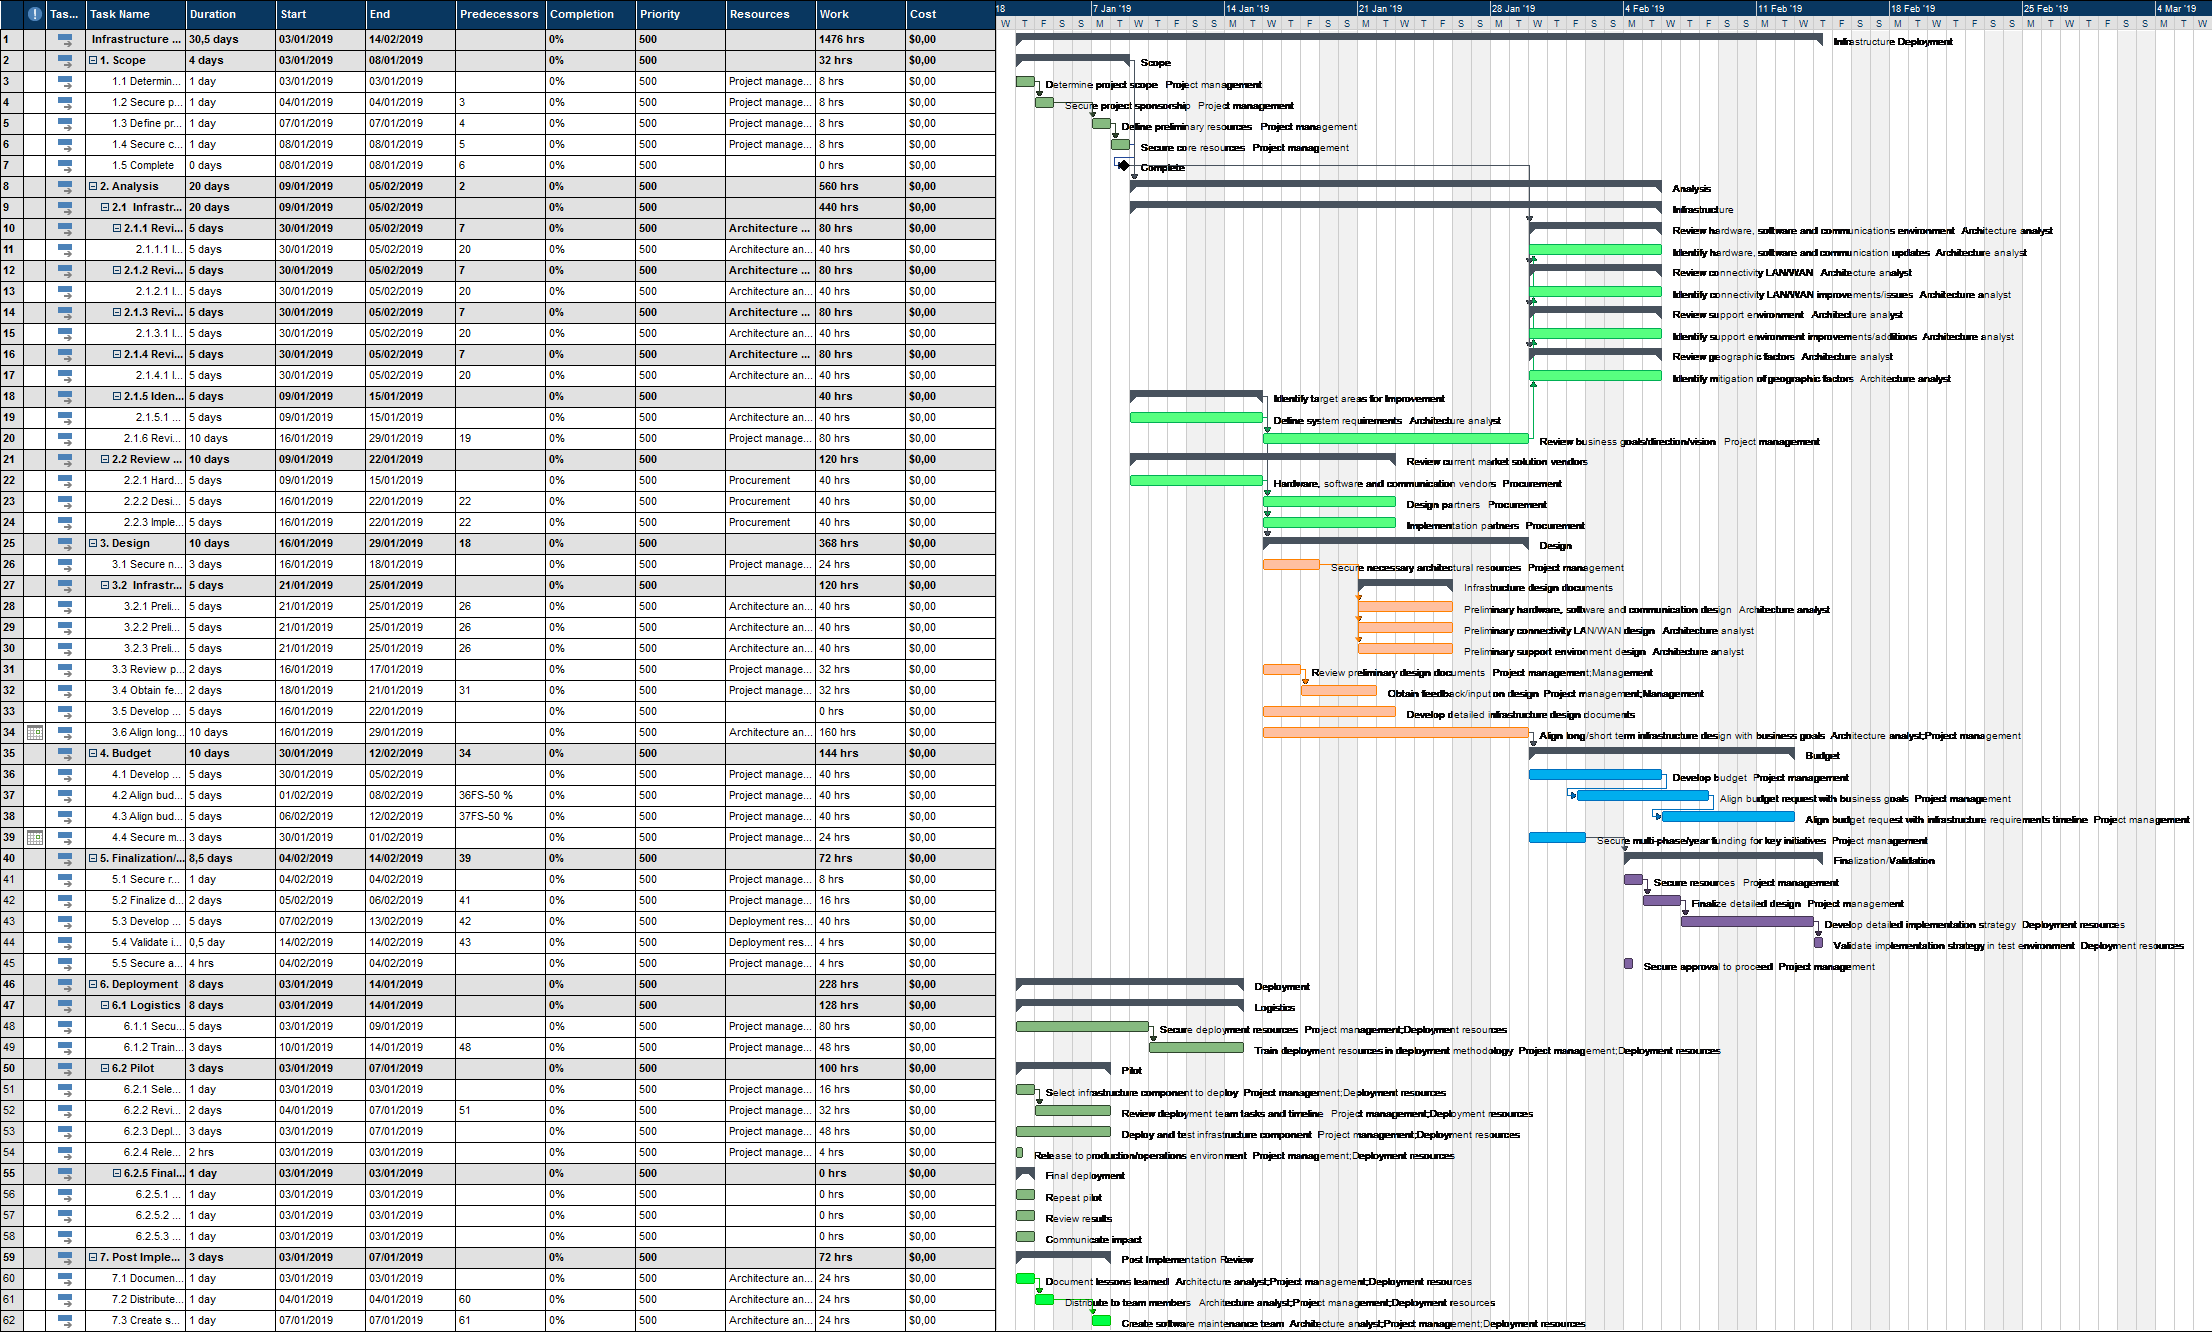
A Gantt chart is a visual timeline that shows:
Tasks and activities
Start and end dates
Task dependencies
Progress over time
It helps teams understand what needs to be done, when, and in what order.
Experience shows that many IT and networking delays happen due to:
Poor task sequencing
Unclear timelines
Missing dependencies
Gantt charts help reduce these issues by providing a clear visual structure.
Router and firewall installation timelines
Cabling and infrastructure phases
Testing and validation scheduling
Site survey stages
Access point installation
Optimization and performance testing
CCTV and access control rollout
Device installation sequencing
System integration timelines
System upgrades and migrations
Maintenance windows planning
Documentation and handover phases
When choosing a Gantt chart tool, experience suggests focusing on:
Easy task creation and editing
Clear dependency management
Drag-and-drop timelines
Progress tracking
Export or sharing options
Simplicity is often more valuable than advanced features.
| Task Lists | Gantt Charts |
|---|---|
| Show what needs to be done | Show when and in what order |
| Limited timeline visibility | Clear time-based structure |
| Minimal dependency control | Strong dependency mapping |
For technical projects, both are often used together.
Gantt charts are most effective when used for planning and coordination, not micromanagement.
Keeping charts realistic and updated improves their usefulness.
Break tasks into manageable steps
Avoid overly detailed timelines
Update progress regularly
Adjust plans when dependencies change
Use charts as guidance, not rigid rules
WiFi EG provides informational content about project planning tools such as Gantt chart makers.
This content is educational and does not endorse or guarantee specific project outcomes.
Explore Project Planning Resources
or
Learn How to Plan Technical Projects Effectively

By clicking the button, you are agreeing with our Term & Conditions